
Reporting Page
This page provides various views and interactive filters to help you view and analyze data in the format that best suits your needs. You can switch between different views such as Table, Timeline, and Graph, and apply several filters to narrow down the information.
Views
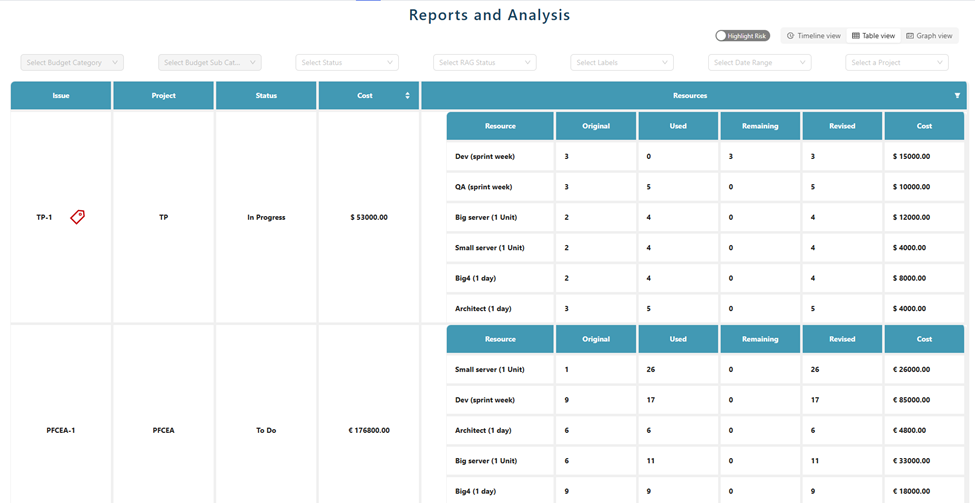
1. Table View
The Table View presents data in a structured table format with the following columns:
Budget Category
Budget Sub Category
Status
RAG Status
Labels
Highlight Risk Feature
This feature visually highlights data points that are at risk based on resource utilization:
Red: Resources used more than 80% (High Risk)
Amber: Resources used between 55% and 80% (Moderate Risk)
Use the Highlight Risk switch to toggle between Normal and Highlighted Risk views.
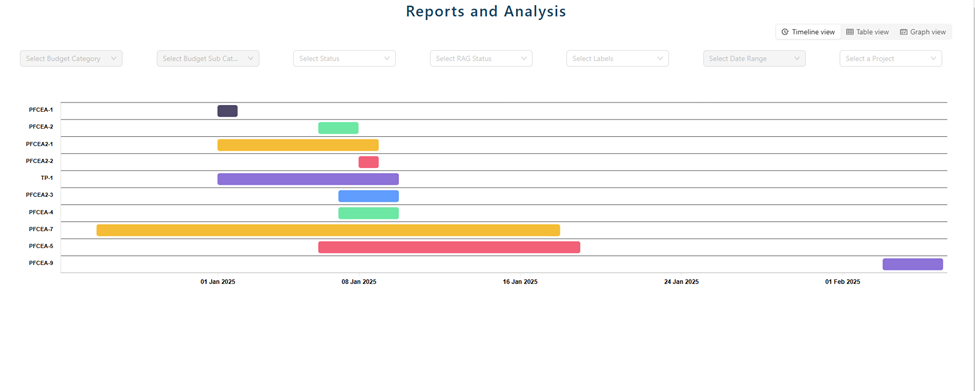
2. Timeline View
The Timeline View visualizes project progress by plotting projects based on start and end dates. It helps:
Show project duration and overlaps with other projects.
Track milestones and deadlines.
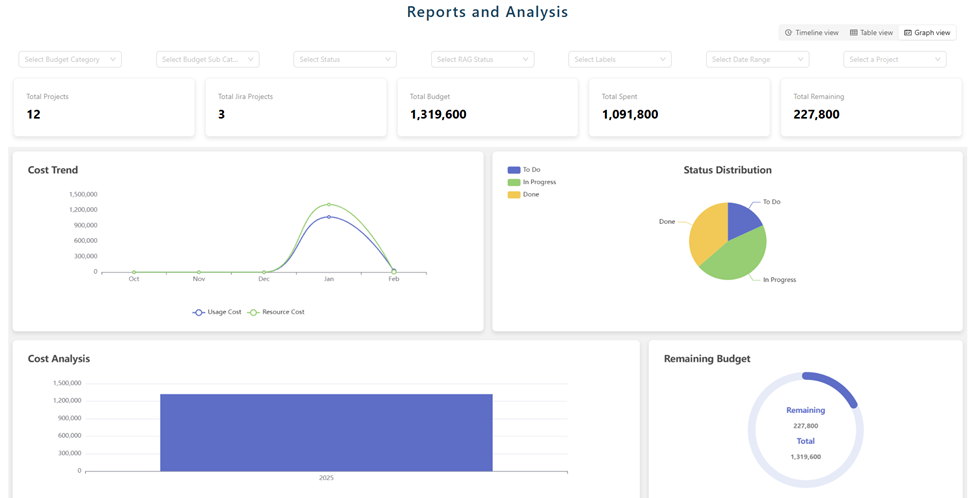
3. Graph View
The Graph View presents data in a graphical format, helping to analyze metrics through visual representation. It includes:
Charts and graphical elements for quick comparisons.
Multiple data series to highlight trends, totals, and comparisons between metrics.
Filter Descriptions
Budget Category & Sub Category: Available only in Graph View, allowing filtering by category and sub-category.
Status: Filters by one or more status values, available across all views.
RAG Status: Helps highlight risks using Red, Amber, Green indicators, available in Table, Timeline, and Graph Views.
Labels: Filters data based on associated tags, available across all views.
Date Range: Filters data by time frames such as This Month or Last Month, available in all views except Timeline.
Project: Filters data for one or multiple selected projects, available across all views.
How to Use the Filters
Select the View: Choose Table, Timeline, or Graph View using the Segmented Control at the top of the page.
Apply Filters: Select one or multiple filters such as Budget Categories, Status, and Labels.
Interact with Data: The displayed data will automatically update to reflect the selected filters.